How Zone System Works: A Conceptual and Technical Sketch Part I
(I started getting e-mails about Zone System due to search engines associating my Death of the Zone System series with another article about how the Zone System is Dead. My title is ironic since I use Zone System and believe it a useful tool for any photographer. My belief is that quality information about ZS on the internet is lacking which is leading to the dissemination of misconceptions that discourage and dissuade others from learning this technique – hence, the Zone System is dying a death due to misinterpretation and misinformation. Before I address the argument made in Johnny Patience’s The Zone System is Dead I am producing two pieces; the first explaining how Zone System works on a conceptual and technical basis and the second detailing the steps of how I calibrated my film/paper combination. Once these are posted I will follow up with an analysis of Patience’s arguments in an effort to dispel a number of mythologies and further explain how his metering method falls short as a system of tone reproduction.)
1.0 INTRODUCTION
The Zone System helps solve a complex problem in a simple way. That is - how to capture light from a scene and through a competent control of each step in the photographic process produce an image that aligns closely to either what you saw in the scene or in your mind’s eye. I believe the canon of Adam’s The Negative, Zakia, Lorenz and White’s New Zone System Manual and Phil Davis’ Beyond the Zone System do an excellent job explaining ZS on both a creative and technical level. And yet, in this age people looking for easy answers are disappointed by the Zone System’s long learning curve. So why would I say it’s a simple answer to a complex problem? Because the technical adjustments of tonality using the scientific methods of sensitometry is very complex and requires one own some rather obscure equipment. Zone System is not only an ingenious way to bring this science into the hands of the entire photographic community, but also provides a visual vocabulary and method of marrying the artist’s subjective vision to the technical photographic process. I may own several light meters and use a densitometer to calibrate my materials, but I still rely on the Zone System to understand how I perceive tonality and manifest the vision from my mind’s eye onto paper or electronic screen. Simply, Zone System is the easiest method in our possession and I think it helpful to explore the science and concepts of how it works in order to encourage others to consider learning it as well.
1.1 Language Clarifications
I am writing this for use with both analog and digital photo processes so we should clarify some terminology I use. I prefer the general term sensor for both film and silicon semiconductor imaging. This is to disconnect any medium-centric thinking and ground us in the shared processes between light-sensitive materials used for photographic imaging. I will be clear if any aspect is particular to digital or analog photography.
Processing or image processing is the general term I use for film developing or image adjustments in computer software. Once again, there are many commonalities to both mediums in the general process of tone reproduction. Also, I try to keep clear the individual steps of the process by separating out what you saw in the real world as the scene, the captured image as the negative or digital file, and only the final image as the print on paper, the projected motion picture print, or electronic display in the form of a monitor or electronic projector.
Finally, I make an important distinction between ISO and EI. ISO is the measure of sensitivity of a sensor as dictated by the ISO organization in their standardized tests ISO 6:1993 for black and white film, ISO 5800:1987 for color negative film, and ISO 12232:2006 for digital. Due to the fact these tests are really laboratory protocols for a manufacturer the photographer may realize they need to rate their sensor differently based on the circumstances of a scene or for a desired aesthetic. In the case when photographer or a camera manufacturer recommends a different speed rating this is properly referred to as an Exposure Index or EI. (“Native ISO,” a term that is entirely made up by digital camera manufacturers, is analogous to EI.)
2.0 TONE REPRODUCTION SIMPLIFIED
Sensitometry and Zone System provide technical grounding and visual control over the process of tone reproduction. The process reduced to its simplest steps is as follows:

Diagram 2.0 - Although illustrated for analog photography these three steps are equally applicable to digital with Processing done in a computer and the Final Image seen on a computer monitor.
I will address the middle section of Processing in Part II of this article. For now imagine it as a machine with dials we can adjust for different image qualities but for the moment they are set to “default.” In this instance the entire photographic system becomes a “black box” where we measure and control the light inputted into the photographic system and observe the appearance of the image at the end. We then ask ourselves a series of questions about the quality of final image comparing it to the scene we remember or scene we previsualized. Based on our assessment we then proceed to adjust the process to dial up more or less contrast, raise or lower the brightness, etc. until we get a final image to our desired aesthetic. To give an example let’s say one took a photograph of a black and white cat. Black and white fur is notoriously hard to render well for film and digital.

Diagram 2.1 - My father, who first taught me film photography and darkroom printing, loves black and white cats as an example of a difficult photographic object to render tonally. I doubt our photographer friend above would really take this photo as an expression of his artistic creativity, especially since it includes a graycard and a Zone System visualization strip. Nonetheless, these technical items needed to be in the photo for important data later in the article.
If your hope was an outstanding artistic depiction with both black and white hair rendered with detail and nuanced tones to occur from “default processing” it’s highly unlikely your photographic system would produce this result. (By “default processing” I mean you rate the film at the ISO listed on the box, use developing times from a manufacturer or in the digital realm allow Photoshop to apply image processing to the RAW file with default curves, color temperature, etc.) As I will explain a little later, there is a small probability that circumstances and materials will align to produce a stunning final image. But in reality what will most likely happen is something along these lines:
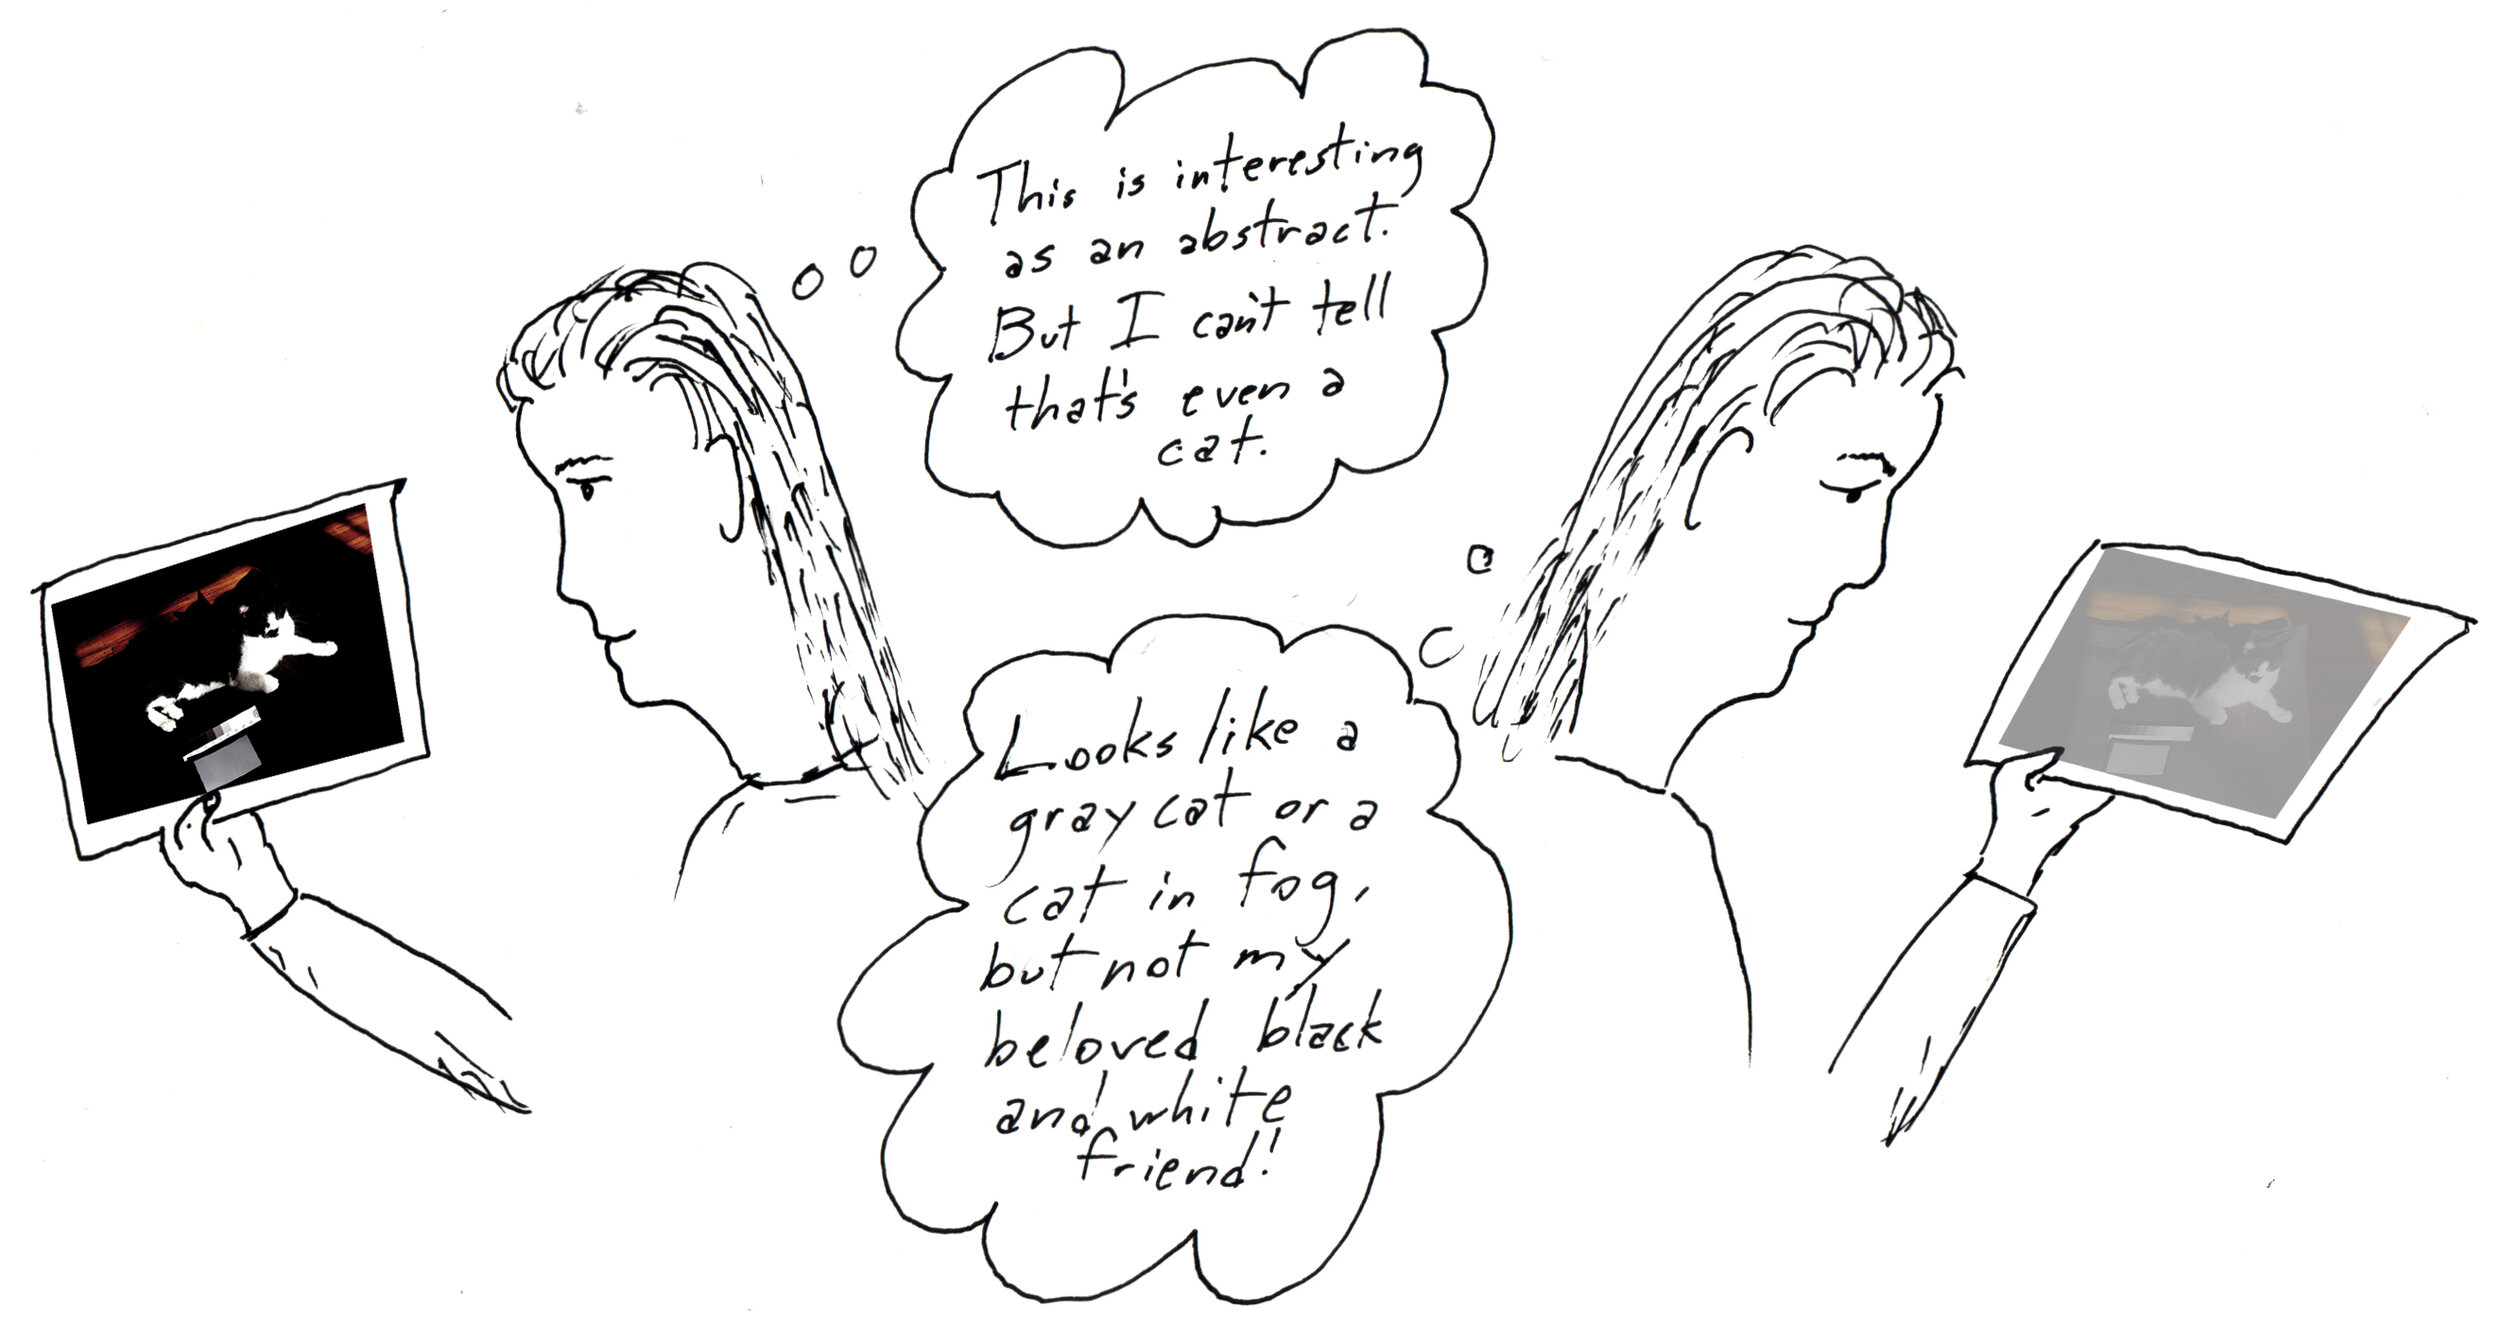
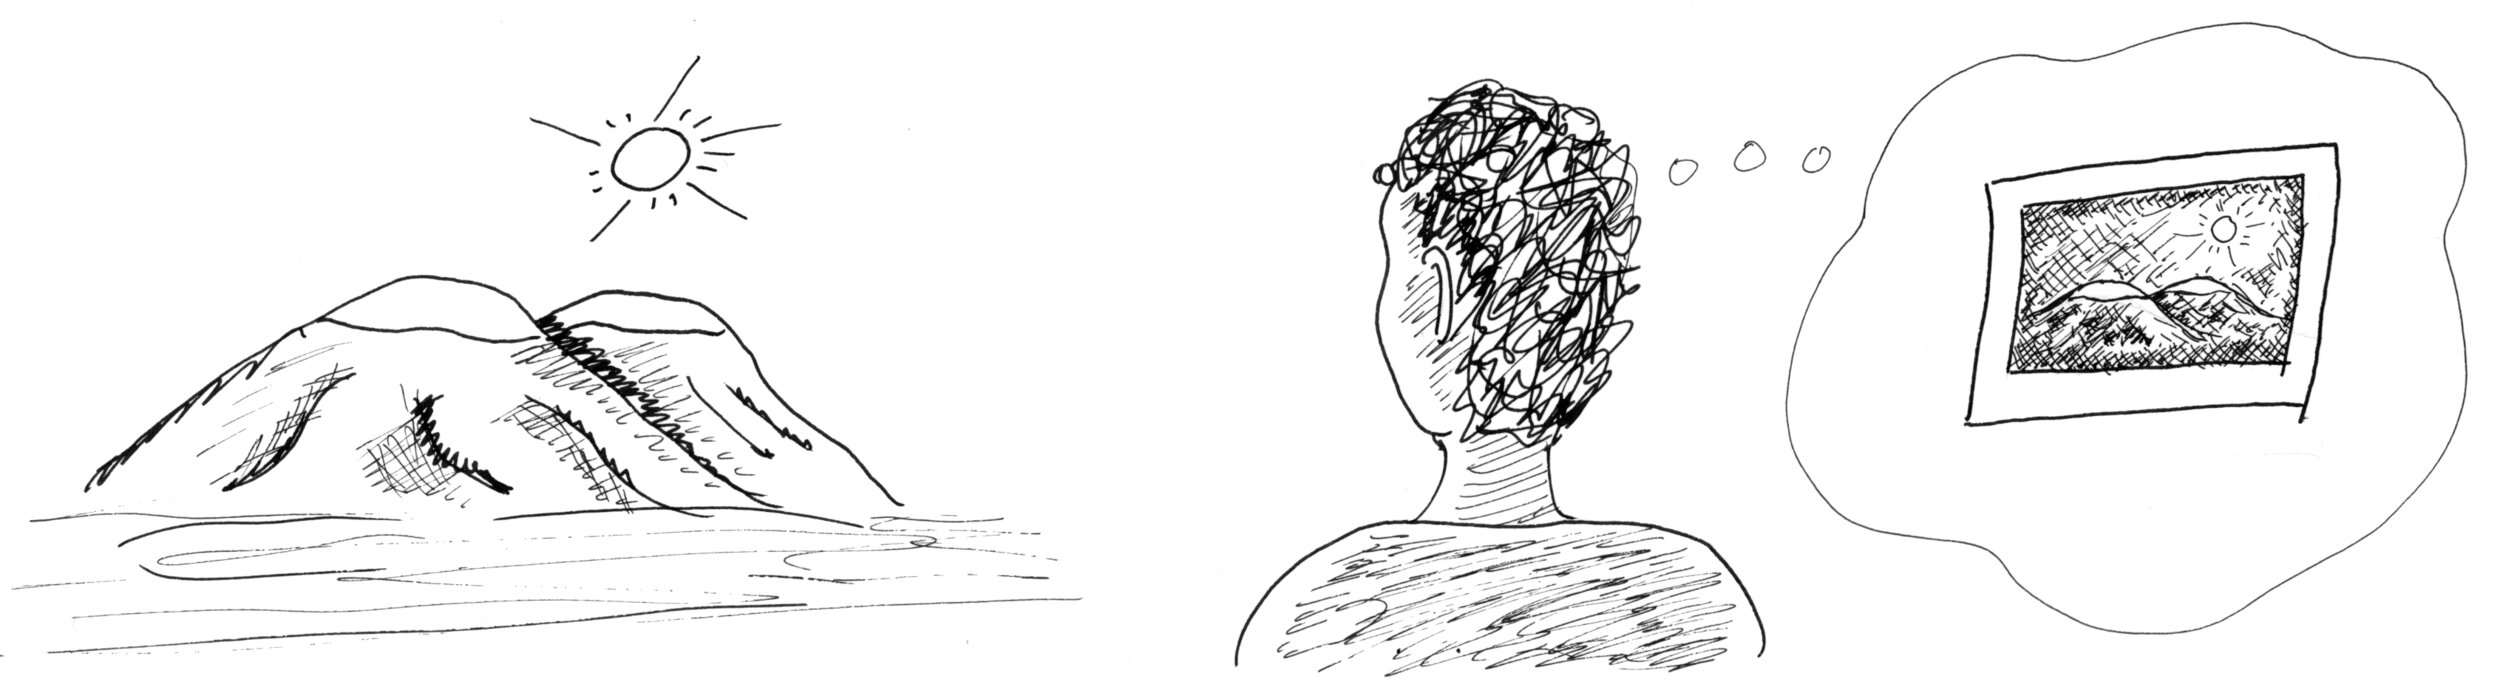
Diagram 2.2 - I make a point with my students that taking a photograph merely means pushing the shutter button and just merely throwing on a pre-built Instagram filter or leaving “auto” modes on. On the other hand, making an image means previsualizing an image, engaging your visual memory, and critical assessments of the image quality.
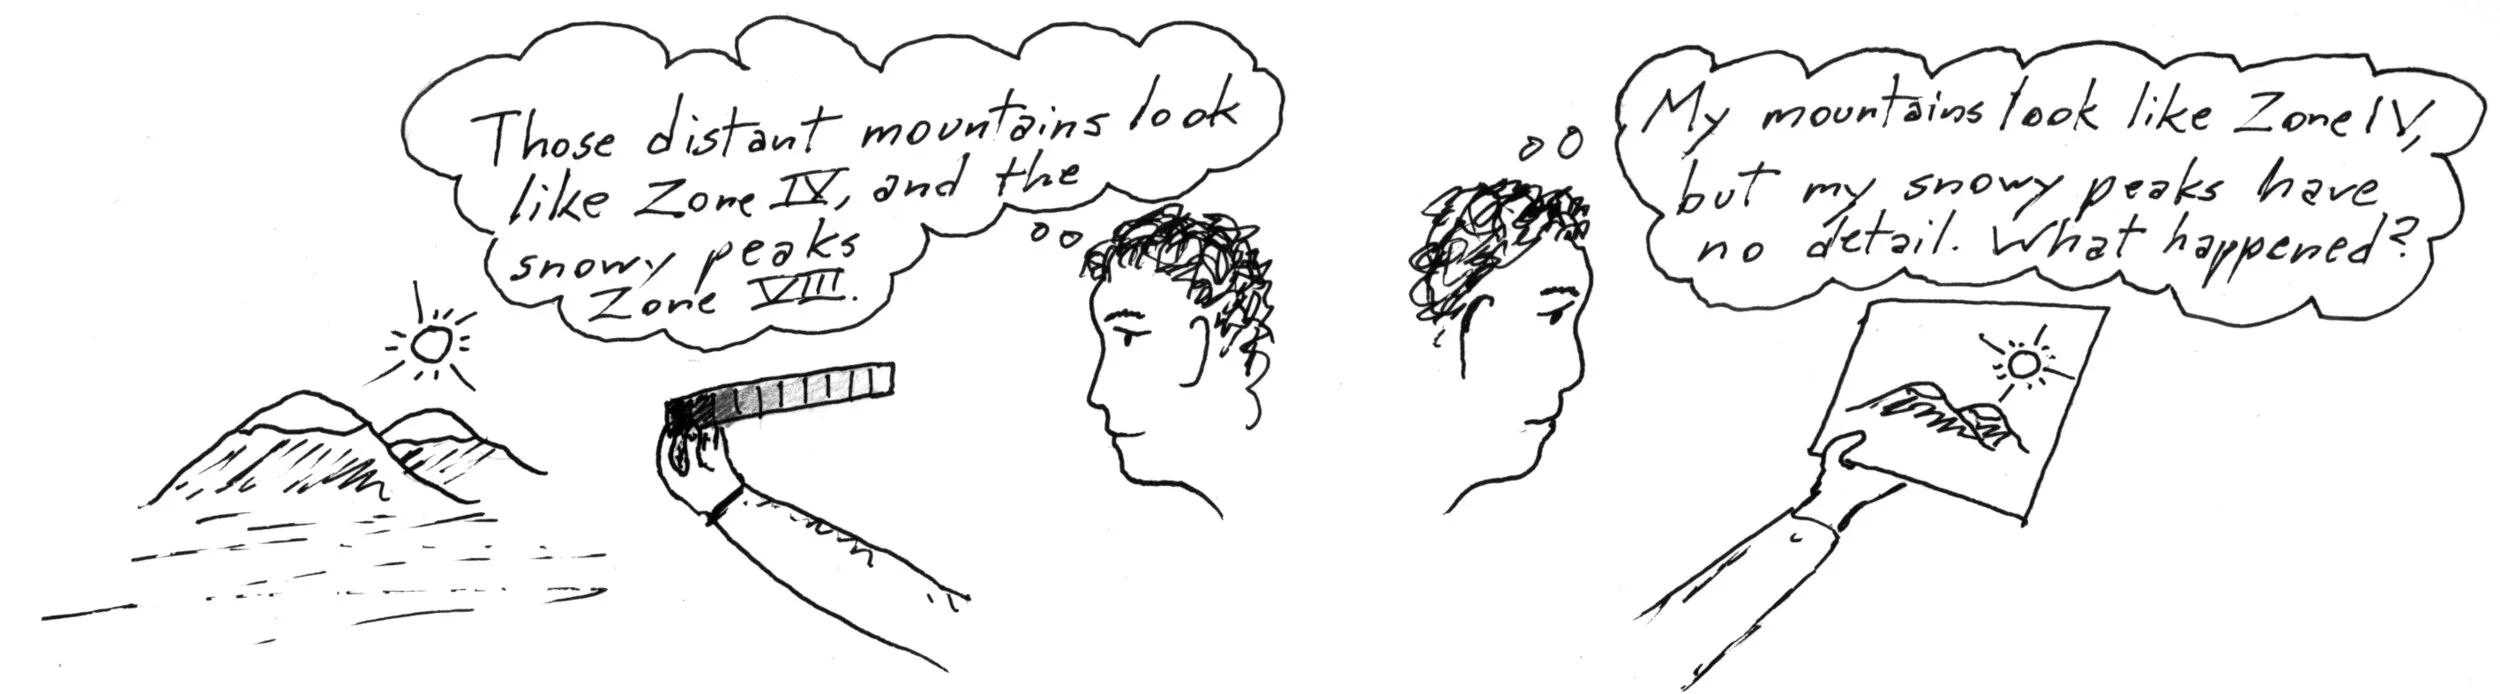
Comparing your scene (through one’s memory or even light meter notes) to the image one can tweak the process chain until a desired result is achieved. So how does one learn to control their photographic process to control the tonality from scene to image?
2.1 The Many Roads to Learning Tone Control
Admittedly, there are many roads to learning to control tonality. One can do this by trial and error, careful experimentation and testing, or learning Zone System and sensitometry. In my experience trial and error (what I started with) is frustrating, inefficient, and expensive. Being more scientific by following steps methodically and taking notes is more efficient and the results can be quite good with attention and diligence. I find people decades into their photography careers who follow this path of rigorous attention and a solid technical understanding of the steps needed to achieve the aesthetic they need. I call these people “unwitting ZS users” because they are engaged in the process deep enough to control the result, but may not use ZS or sensitometry terminology. Finally, those who labor to understand ZS and sensitometry bring a comprehensive and embodied knowledge to the photographic process and are very adept at interpreting situations and problem solving. I’m not saying these are discrete levels of engagement, but that they admit of a spectrum. However, I cannot emphasize enough that a full engagement has very desirous benefits that cannot be denied.
If Zone System is so simple why do so many amateurs and occasionally professionals fail to understand it? Well, there still is a barrier to entry – a set of prerequisite lessons and experiments to perform to really embody the knowledge. A few I can think of are –
1. Empower the photographer’s ability to previsualize an image. This is important because image making requires that we can see in our mind’s eye a meaningful idea in which to express through the craft of photography.
2. Development of a visual memory so as to not only remember the scene photographed, but also compare tonality from the scene to the canonical Zones.
3. An understanding of the tool of the light meter and how to interpret its data.

4. Technical proficiency and consistent execution of image processing in a darkroom or computer.
5. Time spent testing one’s photographic process to calibrate materials for different subject brightness ranges.

6. Meticulous note taking and self-assessment to learn from mistakes and build up mental database.

7. A good teacher!

My hope in enumerating these prerequisites is not to dishearten those interested, but separate the components into digestible ideas that can be worked on individually in service to the greater goal.
3.0 HOW DOES THIS WORK?
Even though ZS is founded on a well-established science of tone reproduction there is recently a great deal of doubt cast on the process. Even if we treat the middle step – Processing – as mere technical execution this still leaves some unanswered questions. How can it be possible to move tonality in a scene to a piece of photo paper when the quantity of light is magnitudes different? Why does the number of Zones not match the range of tonality in nature, or the range my camera can capture?
3.1 Absolute vs Relative Tone Reproduction
First, keeping the appearance of tones/Zones intact is achieved by maintaining the relative differences of values to each other. Sensitometry studies two kinds of tone reproduction – Absolute and Relative. Absolute tone reproduction entails that photometric quantities of light emitted in a scene are the exact same as those in the final display.

Diagram 3.1 - You have probably experienced how straining on the eyes it is to look at bright computer screens in indoor settings as well as how blinding snow is in sunlight. Imagine a monitor so powerful as to output the intensity of the sun into your house!
Obviously, this is extremely difficult from a practical standpoint and it seems foolhardy to engineer visual displays that emit the same quantities of light as in the outdoors. Thankfully, there is a more effective route which is to lower the overall amount of emitted or reflected light by the display, but maintain the relative difference between all the tones.

Diagram 3.2 - Despite the limited range of photographic materials, they still contain enough range to satisfy our visual system.
Despite the overall transformation blacks appear black, whites appear white, and middle gray is still middle gray.

Diagram 3.3 - When taking the photo of the cat I took luminance readings (candelas/meters squared) with my light meter. I rounded the numbers slightly, but nonetheless one can see how the white fur is 8 times greater than the graycard (a difference of 3 stops), and the black fur is 8 times darker than the graycard. After adjusting the image in Photoshop by eye I metered the luminance values emitted from my computer screen. Once again, you can see that the white fur and black fur are 8 times, or 3 stops, above and below the graycard respectively.
3.2 Zones and the Human Visual System
If the Zones are being moved to such radically different photometric quantities how is the photographer able to maintain their relative differences? For this Adams and Archer’s visual Zone definitions are a powerful tool of comparison throughout the process. True, we adapt to different brightness levels, but we are extremely good at detecting differences in side-by-side comparisons. (Salvaggio and Shagam 2020, 283) This is why every ZS book recommends carrying a printed comparison card, such as Stouffer’s Zone Card, into the field to help relate objects to Zones. I cannot emphasize enough how important it is to practice looking at objects in your scene and developing the visual memory and tonal discrimination to determine what Zone is closest. Perhaps this quote sums it up best:
Every object, well contemplated, creates an organ of perception within us. - Goethe
Then, comparing our image at each step of the photo process to the Zones we can successfully learn how to manipulate the “dials” of contrast, brightness, etc. in the Processing step. By exercising our visual system’s ability to relate scene zones to image zones it’s easy to understand the potential to align their photographic process with their creative vision.
3.3 How Many Zones?
The next big point of confusion arises from questions surrounding the number of Zones frequently leveling the accusation that we need more Zones because digital cameras have a large dynamic range. The confusion comes from the erroneous attempt to equate Zones to the Dynamic Range of their camera or film. (Dynamic Range (DR) is the difference between the smallest to greatest recordable signal by a medium. The DR of both negative film and most professional digital cameras is in the order of 13 to 16 stops.)
Equating the DR of film to Zones was never Adams and Archer’s intention. Instead, the Zones are entirely described by the appearance to your eye (Adams 1981, 49). So, the Zones are based on our visual system – the DR of our eye/brain system, which in most circumstances is only about a 200:1 or 7 2/3 stop range. (There are some variations based on adaptation to an average light level but suffice it to say we are about 7-8 stops at the light levels used in print and projection.) When you look at a scene you lose details in the shadow and highlights beyond this 7-8 stop range. You may “feel” the range is greater since you can look into a dark corner of a room and start to make out detail or look at a bright light and see detail in the bulb. However, in these moments we are unaware of how we are adapting and losing detail on the other end of the scale. (If you still resist this fact I recommend setting up two graycards separated by a solid, but thin division. Light them separately so they are 12 stops or more different in intensity. Look at both graycards in the same field of view of your vision and get back to me on the results.) So having 10 Zones over a 10 stop range is plenty for a pure black, pure white, and a range of grays that are rich in detail in between.

Diagram 3.4 - From Ansel Adam’s The Negative. Notice the tendency to ignore Zones 0 and X since they are beyond the tonal values of interest to us. The Dynamic Range covers 9 stops and the range of objects with texture (or detail as I like to say) is 7 stops. (Adams 1981, 52)
The research on this was established many decades ago and I have written about this before in this post which includes citations of pertinent sources. Some of you may be wondering about HDR monitors since many are touting claims of 13 or more stops. That may be so, but there is little evidence such a large dynamic range is needed. In fact a graph of tonality from a recent talk on HDR projection is revealing because the straight line portion of the projector curve covers 8 stops, the rest of the 13 stop range is a soft roll off of shadow and highlight detail. I hope to address this more fully in a future post.
Regardless, the limit of our eye helps explain why the seemingly narrow range of print material works – it fits our eye! The same is true of theatrical projection and computer monitors.
(A quick note about the limited DR of reversal films – since these are direct positives the camera original must display a visually acceptable contrast range after development. This is why in the field they already have a narrow DR and in projection are very contrasty compared to a negative.)
3.4 Is there such a thing as a “Normal” scene?
By logical extraction, if our eyes have a static dynamic range of 7-8 stops than we must have evolved these limits because it provided us with a suitable amount of information from the world in order to survive. Are most scenes in nature about 7 to 8 stops? Rather amusingly, I stumbled upon early sensitometric research where a study showed nearly exactly that. Below is a graph from a study of the range of photographed scenes and one can see that the majority of outdoor photos were of scenes with a contrast ratio of 160:1 - that’s 7 1/3 stops!

Diagram 3.5 - From a study by Jones and Condit investigating the luminance ratio of 126 photographs taken outdoors (James 1977, 549).
Photographic materials optimally fitting this 7 to 8 stop light range to the final image are legion. In my own class we took the curve of Kodak’s 2383 motion picture release print stock and used it to analyze the optimal contrast ratio of a scene to record onto the negative. Each student was given a different negative stock and all the values cluster around 7 to 7 1/3 stops of light as the ideal contrast ratio of a scene. I have done this with computer monitors and projectors as well to find the range of their light output is about 7 to 8 stops.
My reason for re-iterating this range of our eye and how it is integrated into the photographic system is to provide a more substantive definition of “normal” developing time or “normal” contrast. I’m typically wary of the word “normal” applied in the sciences and arts, but this tells us something important about our materials. A typical scene in nature is about 7 to 8 stops, and the published ISO and developing time by a film manufacturer are designed to hold that same range of light in order to best fit the final image display.
But scenes are rarely ever “normal” in their light range? Exactly, which is why sensitometry and Zone System exists. These are tools to help us interpret the range of light in a scene and adjust our exposure and processing accordingly to the image medium we are finishing to.
3.5 Tying it Together
Putting these facts together one can begin to appreciate tone reproduction as it has been already studied for the photographic arts. We first perceive a scene with our eye which has a limited static DR. We capture this onto a sensor that often has a much greater DR, but process the final image in a way that once again is tailored to the limits of our eye. The greater DR of the capture sensor (film negative and RAW files) allows us flexibility in post, but how much flexibility is debatable since large scale changes can have significant impacts on quality.

Diagram 3.6 - The scene we observe with our eyes is only about 9 to 10 stops and 7 to 8 of those stops carry detail of the objects. A camera sensor may as much as a 16 stop Dynamic Range. We can choose where to expose our scene within the limits of the sensor, but obviously if we stray beyond these limits than information is lost. Also, choosing to place our scene close to either end of the sensor’s DR has impacts on image quality whether in terms of increased noise, or lost tonal detail.
You may have noticed when you began taking pictures that occasionally you obtained a great image quality with your “default” settings. This was due to the chance alignment of the range of light in the scene you photographed and the range of tonality successfully funneled through your system to the final display. You noticed that it was great when it happened, but not all the time. So how can we make this alignment always occur? Well, that comes from controlling the middle section – image processing. I will address processing for film and digital extensively in part II of this article.
References:
Adams, Ansel. The Negative. Boston: Little Brown and Company, 1981.
James, T.H., ed. The Theory of the Photographic Process, 4th edition. New York: Macmillan Publishing Co., Inc., 1977.
Salvaggio, Nanette L. and Josh Shagam. Basic Photographic Materials and Processes, 4th edition. New York: Routledge, 2020.
Edits and Corrections:
24th of March, 2020 - Following a conversation with Dwight Primiano I added the writing and image about previsualization to section 2.1.